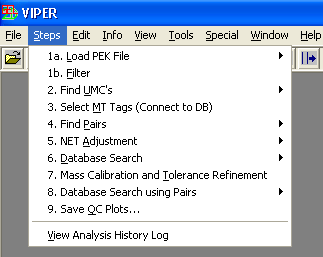
VIPER (Visual Inspection of Peak/Elution Relationships) is a free tool that used to visualize and characterize the features detected during LC-MS analyses. It is primarily intended for processing deisotoped data from high mass measurement accuracy instruments (e.g. FT, TOF, or Orbitrap) and comparing the features found to a list of expected peptides, as practiced by the AMT tag approach.
The software allows one to display the data as a two-dimensional plot of spectrum number (i.e. elution time) vs. mass. It can read MS data from several file formats: .PEK, .CSV (Decon2LS format), .mzXML, and .mzData. See the Readme.txt file installed with VIPER for additional details on the various file formats. VIPER runs on Windows computers and requires Microsoft Access be installed to create and edit the MT tag databases. In order to view mass spectra from raw data files, you will also need to install ICR-2LS found above.


Be the first to comment